
Emburse processes more than $75 billion per year in employee expenses, invoices, and card payments. This data can be analyzed to determine trends and patterns across a broard spectrum of business spend categories, which is then used as part of our SpendSmart series of data reports.
Emburse’s quarterly SpendSmart Travel Trends report provides a view into how much organizations spend on travel, as well as trends for booking volume and trip length. This analysis compares travel volume and cost in the April-May-June period from 2019 to 2022, and is based on booking transactions within the U.S. (or originating from, for international air travel).
Air travel
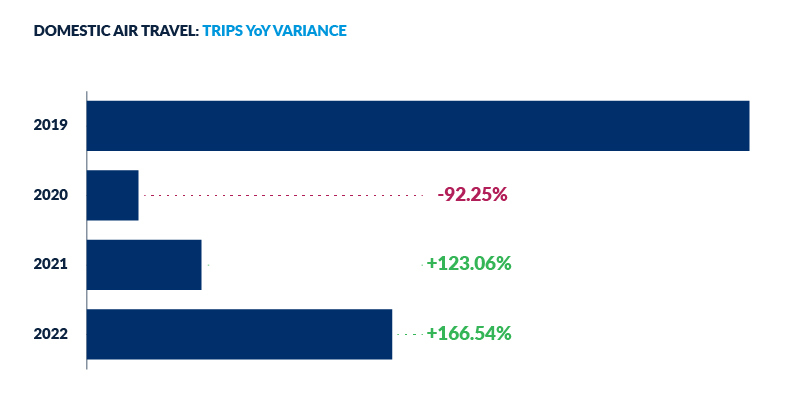
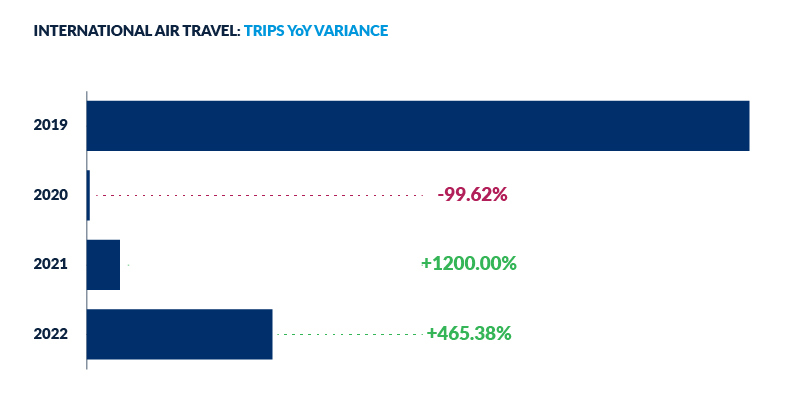
In Q2 2022, airline booking volumes were 166.5% higher than in Q2 2021 and 53.9% lower than the same quarter in 2019. International flight volumes were 465.4% higher than the same quarter in 2021 but 72% lower than pre-COVID Q2 2019.
Car rental
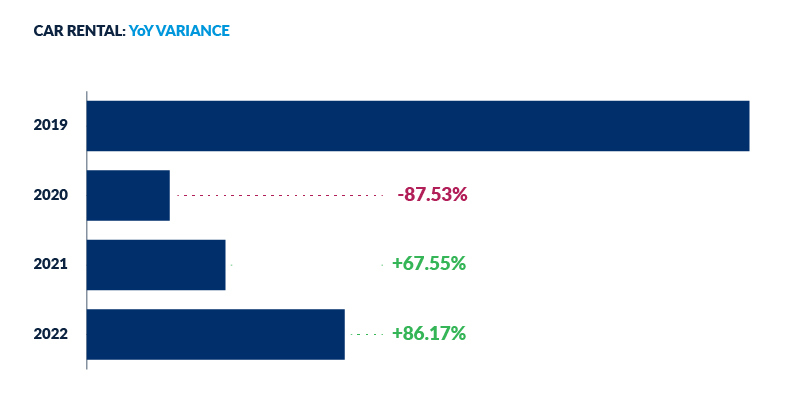
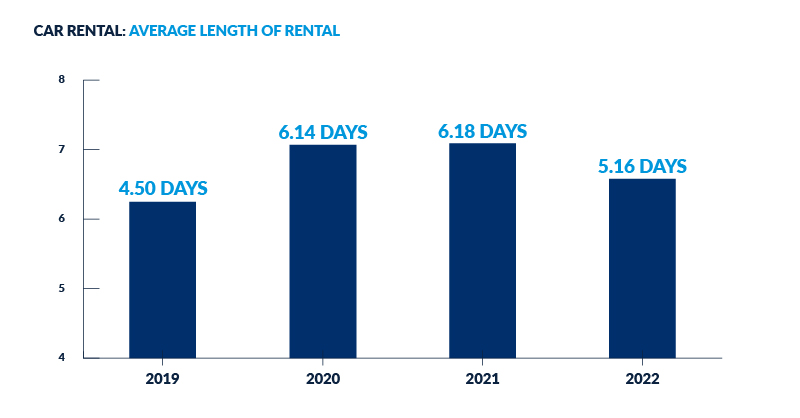
In Q2 2022, car rentals for business trips increased 86.2% over Q2 2021 and dropped 61.1% lower than the same quarter in 2019. Travelers averaged 5.16 days with their car rental in Q2 2022, which is 16.52% shorter than the average of 6.18 days in 2021. In Q2 2019, average length of trip for car rentals was only 4.5 days.
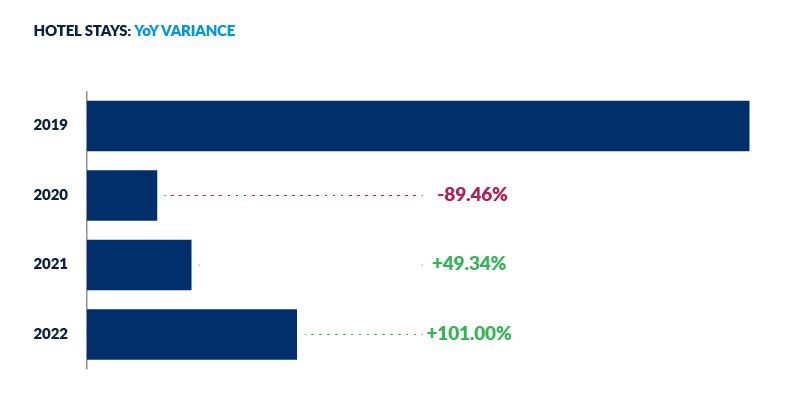
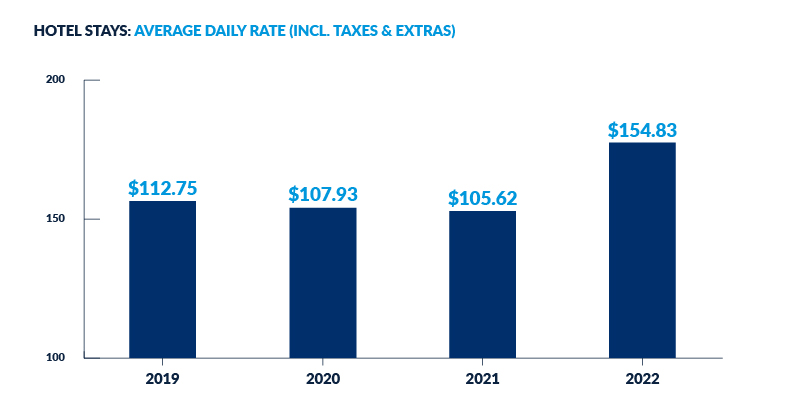
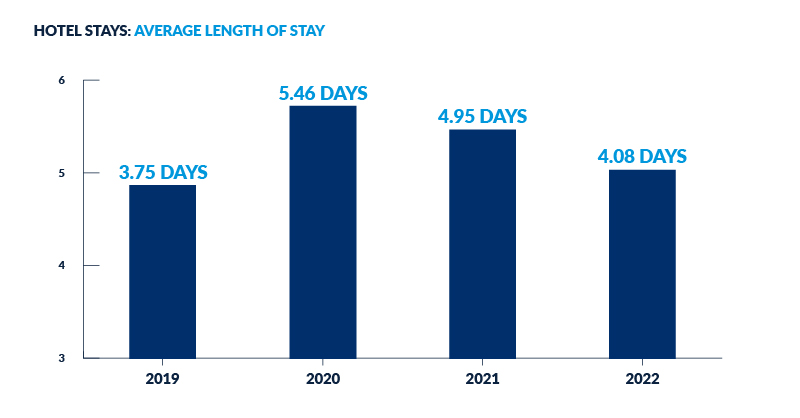
Hotel
In Q2 2022, business travelers staying in hotels averaged 4.08 days per stay. Although there were 101% more bookings than the same quarter in 2021, this reflects a 17.5% drop in trip length. Compared to Q2 2019, it shows a 68.4% decrease in the amount of trips but an 8.8% increase in trip length.
During the thick of lockdown, many anticipated that business travel would eventually return, but with fewer, longer trips. However, the data shows that, while trips became longer for a period of time during the pandemic, they are now reverting back to pre-pandemic lengths of a few days, with frequency of travel back on the rise. It’s too early to see if the pattern will return to exactly that of pre-pandemic times, but it’s certainly trending that way.
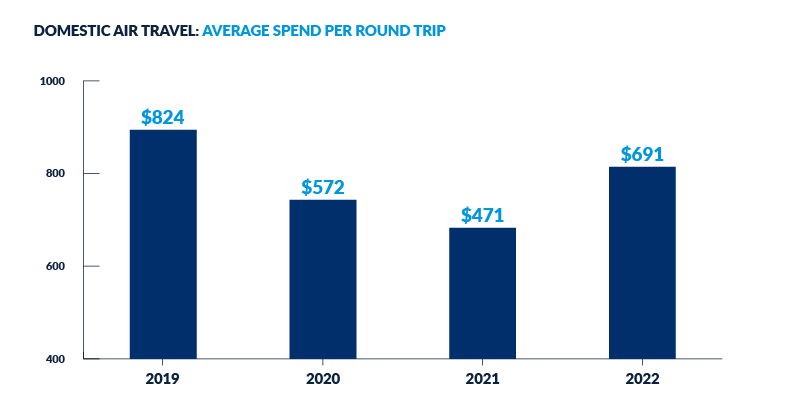
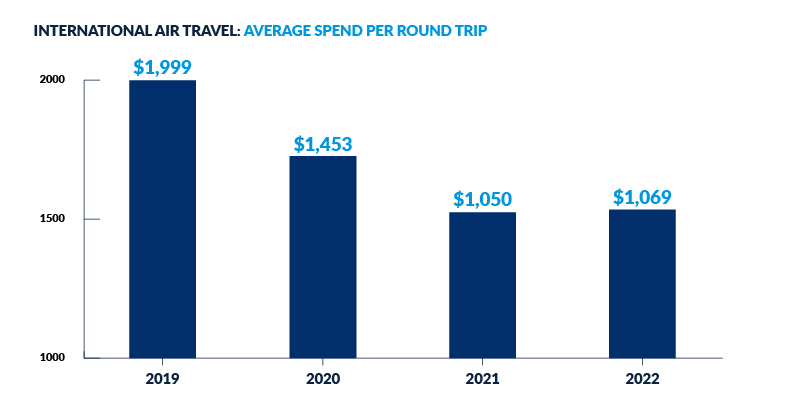
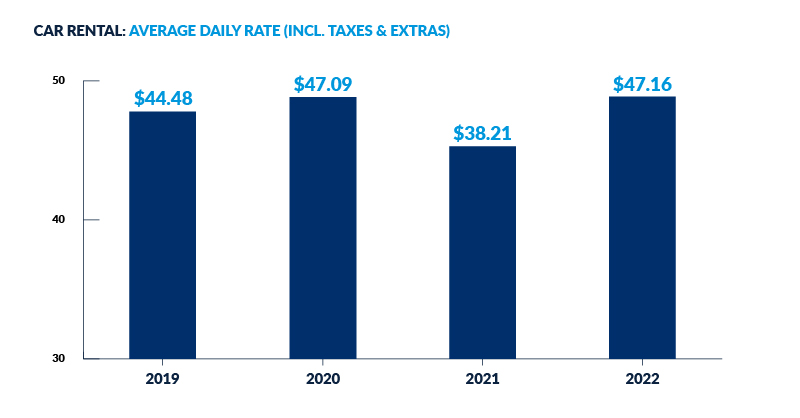
Total spend reflects the same pattern as total trips booked, but looking at average cost per trip, car, hotel, and rail spend are all above 2019 levels. Surprisingly, airfare, both domestic and international, has not yet returned to the same rate of average spend per trip as 2019. That number may jump up in the Q3 analysis since the country started seeing record oil prices in the summer of 2022.
We will continue to monitor these figures and report how they evolve quarterly. You can view the full infographic for the Q2 Spend Smart Travel Trends report here.
Methodology
The data in Emburse’s quarterly SpendSmart Travel Trends report represents over 160,000 individual expensed travel purchases using Emburse’s expense management platform. It is a snapshot of the millions of transactions processed by Emburse’s solutions, and is representative of our data as a whole. It reflects the months of April, May, and June collectively (Q2) for the years 2019, 2020, 2021, and 2022.
Other business travel reports to consider:
US Travel Association: https://www.ustravel.org/research/monthly-travel-data-report
Business Travel News: https://www.businesstravelnews.com/Corporate-Travel-Index/2022/US-Business-Travel-Gets-Busy-in-2022