
Controllers Council recently held our annual Economic Outlook, the 2024 Economic Outlook, sponsored by Allianz Trade.
Our expert speaker, Dan North, is a Senior Economist North America for Allianz Trade. He’s been with Allianz since 1996, and uses macroeconomic analysis to help manage Allianz’s risk portfolio of more than 150 billion in annual US trade transactions. He’s appeared on CNBC, Fox Business News, Bloomberg Radio, and Television. And quoted by Business Week, the Financial Times, NBC, the BBC, the New York Times, and the Wall Street Journal. After having predicted the 2008 and 2009 recession and its implications accurately, Dan was ranked fourth on Bloomberg’s list of top economic forecasters in 2010. Dan holds an MBA from the Wharton School of Business.
Following are key takeaways to this discussion. If you are interested in learning more, view the full webinar archive video here.
Positives in the US
Consumers, 70% of the economy, are still spending
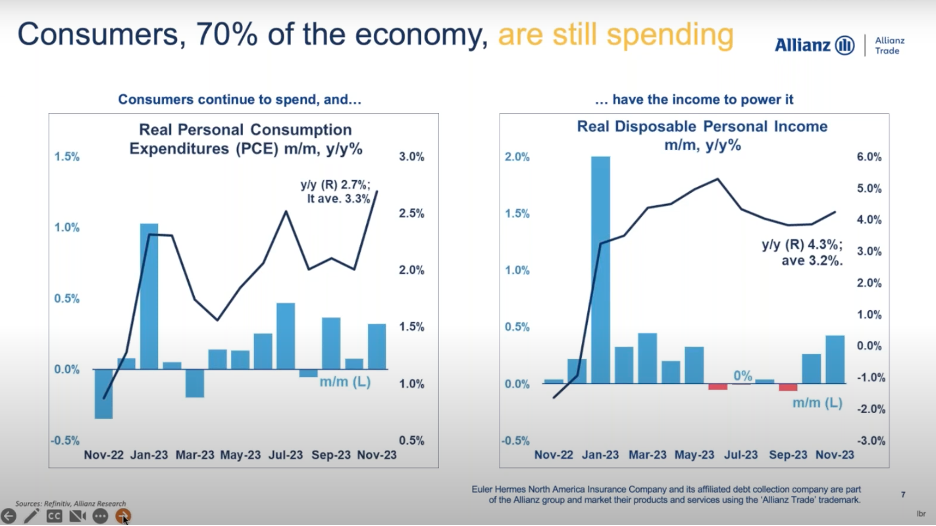
the chart on the left is the month-to-month growth rates in spending, and the black line is the year-over-year, which is 2.7 percent historical average. The chart on the right is disposable income after taxes and changes are shown by the columns. And you can see there are some months recently that have been flat or even negative. But the year-over-year rate, that black line is running at 4.3%. That’s pretty strong altogether. So having the consumer working for us, 70% of the economy is pretty good.
The Labor Market Has Been Very Resilient.
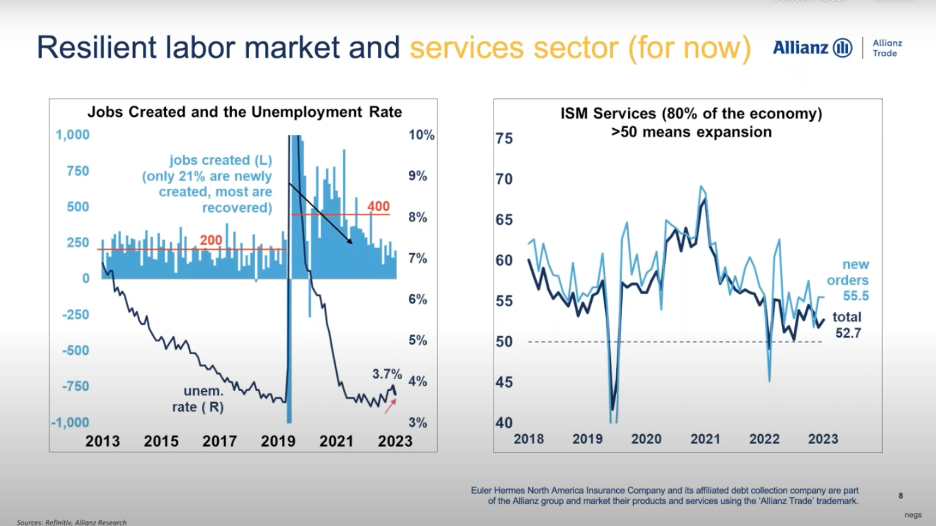
The chart on the left is jobs created and the unemployment rate. Now, there are several things going on in this chart. The black line is the unemployment rate. And you can see historically, it’s quite low at 3.7%. It is rising a little bit, but it’s quite low. And it’s important to know what the unemployment rate represents. The way this is calculated is the government counts you as unemployed.
The other part are those blue columns. Those are the number of jobs created every month. You can see back in 2020 there’s that giant column going way, way down where we lost the 22 million jobs during the COVID shutdown. But ever since then we’ve been recovering jobs at the rate of about 400,000 a month. You can see that red line there across. Compare that to pre-COVID, which was 200,000. You can see we’ve been recovering well. The important point of this, one of them is I’ve been using the word recovering.
We’ve got consumers spending money. We’ve got a labor market that’s been strong, and we have the services sector, 80% of the economy working for us in expansion. So those are some positive things.
Negative Things in the US
Washington and The Budget
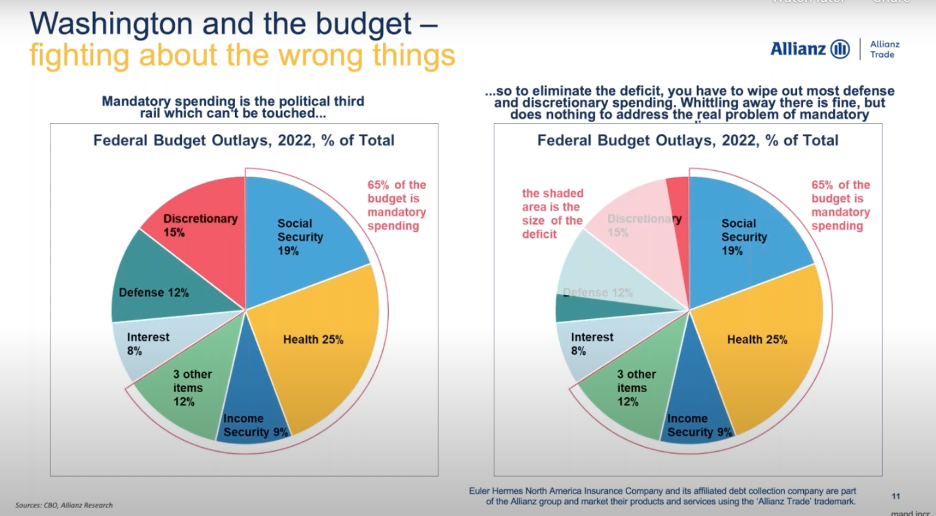
That pie chart on the left shows the budget outlays, percentage of the total. Now you can see Social Security is 19%, healthcare (Medicare and Medicaid) is 25%, income security, and then there are three other items there all wrapped in that red circle. That’s what’s known as mandatory spending. It’s on autopilot. It just keeps getting spent. They never debate about what any of these programs should be. They’re just playing on autopilot, and they’re the third rail of politics.
The red piece of pie discretionary is what you think of as the federal government. Everything you think of as the government is in there, such as Homeland Security, Department of Justice, health, education, commerce, infrastructure. All that stuff that you think of is just in that red piece of pie.
Now, what the chart says is if you want to wipe out the deficit, that white area, you’re going to have to wipe out most of the defense department and most of the rest of the federal government, and that’s obviously never going to happen, and you can’t reform those mandatory programs.
Inflation, the Fed’s Cure, and how it’s damaging the economy
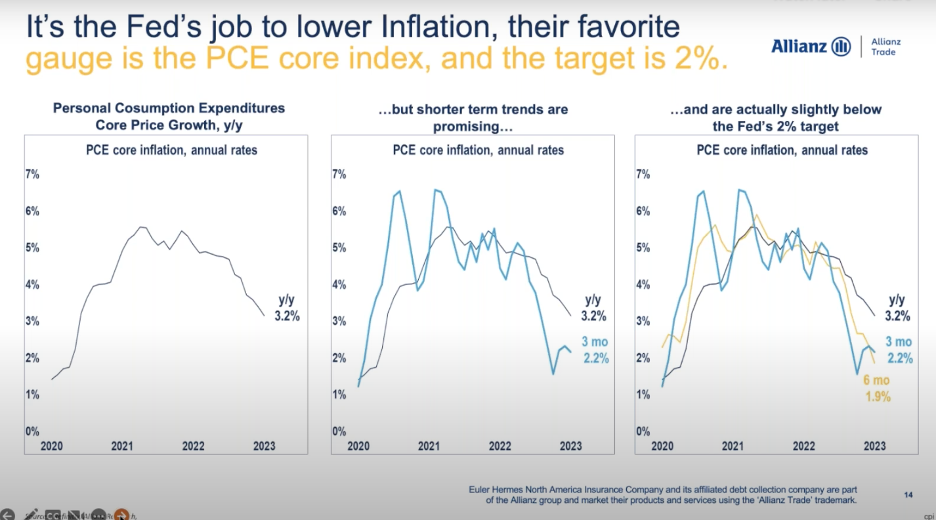
it’s the Fed’s job to lower inflation. Their target, their favorite gauge is what they call the PCE core index. And the target that they like to have that is two percent. Now, that’s the chart over on the left. It’s PCE core inflation running at 3.2% year over year. That’s a long way from two. You can also look at it in terms of more recent measurements like in the chart in the middle. What’s the inflation rate been over the past three months? Well, that’s a little less, 2.2%. The chart on the right shows that yellow line, inflation over the past six months, that’s at 1.9%. So, the point is that those closer, nearer measures of inflation are showing a bit of an acceleration, which gives us some degree of confidence that black line, that year-over-year rate will continue moving to 2%. But it’s a way off.
To view the complete webcast, download full webinar here.
ABOUT THE SPONSOR:
Allianz Trade is a global leader in trade credit insurance, and your partner for trade risk insights and cash flow protection. Allianz Trade can help predict trade and credit risks and protect your cash flow. Backed by Allianz, with more than 125 years of expertise. Allianz trade global business intelligence is unrivaled, using technology driven processes to generate insights and present actionable information to businesses of all sizes and in all sectors.